
Article

How to incorporate out-of-stocks (OOS) in forecasting
We discuss the three top methods for incorporating out-of-stocks in demand forecasting and the relative pros and cons of each.
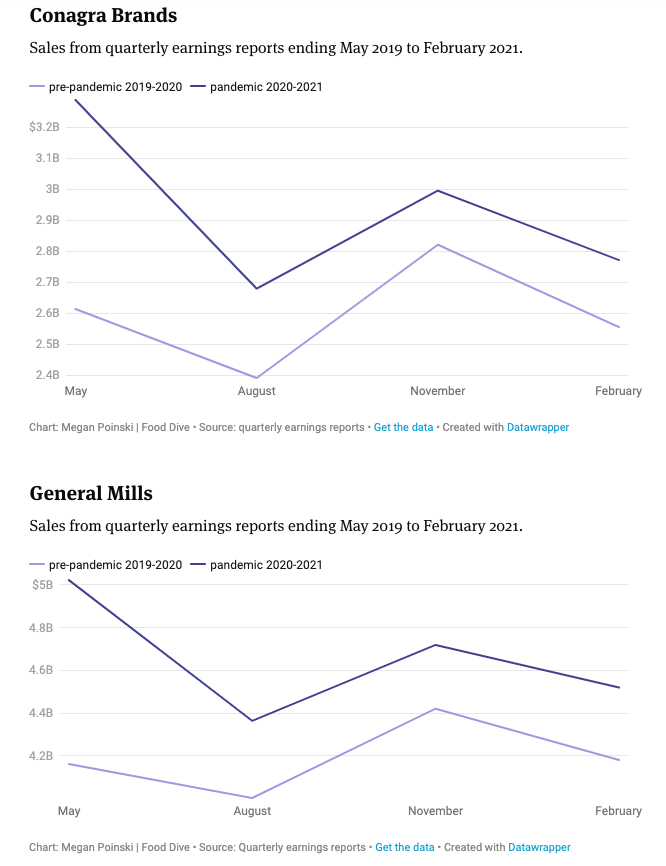
Keep readingSeasonality is incredibly persistent. Even through the tumult of 2020 – waves of Covid-19, lockdowns, re-openings, etc. – seasonal trends seemed to remain intact.
These charts comparing earnings at publicly traded food companies during the four most recent quarters to the same quarters a year before show the general pattern of sales over the course of the year tended to stay the same. The lines are shifted up or down, but their shapes mostly hold.
So it’s logical seasonality is at the heart of a baseline demand forecast. You can count on it, even though reality will deviate (sometimes quite significantly!) from plan. It provides useful insight into how sales will vary over a given period of time.
What’s more, understanding seasonality for each of your products can give you a head start in demand planning. With a good grasp of how much consumer demand varies, you can select the right demand forecasting models, focus on making plan adjustments and spot true outliers that require further attention.
In this article, we’ll examine how to detect seasonality and methodologies to account for it in your demand forecast, while keeping an open mind about whether seasonality is truly at play.

There are three common seasonality types: yearly, monthly and weekly.
A product can exhibit none, one, two or all three types. Because purchases can vary down to the day of the week, it’s important to have daily demand data to build your forecasts and plans. Execution teams will use them to make daily decisions about shipments and collaborate with customers to align replenishment.
You probably have a general sense of your product’s seasonality, but turning it into useful input for forecast requires data. Specifically, store point-of-sale (POS) and e-commerce sales. Customer orders are not a good reflection of true consumer demand, nor for detecting seasonality, because retailers muddy the waters with their ordering algorithms and decisions to stock up or wind down inventory for different reasons.
To check if a specific time series exhibits seasonality, you can perform hypothesis testing on it. Another option is to take a more empirical approach and check whether models with or without a seasonal factor are more representative of your data using a measure like the Akaike information criterion.
Seasonality will typically vary from region to region, depending on local calendars and weather. You may need to segment your data geographically to identify seasonality patterns. At the same time, aggregating forecasts to a less granular level—product category instead of product, for example—may make it easier to distinguish seasonal patterns from random noise.
 Modeling methodologies
Most forecasting methodologies allow for explicit modeling of a seasonal term. SARIMA (ARIMA with seasonality) allows for forecasts based solely on the past values of the forecast variable. The Holt-Winters seasonal method comprises a forecast equation and three smoothing components for the level, trend and seasonal components.
But beware of their limitations and additional accommodations you may need to make depending on the model you select. Some models don’t allow for multiple seasonality, like both weekly and yearly. If you’re using one of these, you have a few options depending on the nature of your data:
Then there are some models that assume integer seasonality. That’s problematic when there are 365.25 days in a 12-month period due to leap years, and the length of a month fluctuates throughout the year.
What’s more, some seasonal events aren’t tied to a calendar date (Lunar New Year, Thanksgiving, etc.), so a seasonal term isn’t the best way to account for them. Instead, you could model them as binary regressors using holiday calendars.
Watch out for times that basic seasonality is not actually the most relevant factor in the forecast. It may just be covering up the true underlying driver. As a result, you would be better off incorporating the regressor variables in the model instead.
For example, purchases of antifreeze have a more direct relationship with the temperature than the precise time of year, as weather patterns waver on an annual basis. With that in mind, using temperature as a regressor variable, instead of modeling seasonality, would generate better short-term forecasts. However, for longer-term forecasts, seasonality would still be an easier way forward. It’s much harder to get accurate weather forecasts on longer timescales.
Once you have a solid baseline forecast, your seasonality picture will become much clearer, so it’s worth the investment to get it right. A good rule of thumb: Go back as many years as possible in order to pinpoint reliable seasonality patterns. When it comes to newer products or product categories, you may need to extract those patterns from similar products or by leveraging syndicated market data.
Then you can focus on the next step for a best-in-class demand forecasting process, making the appropriate forecast adjustments to account for coming events and product dynamics. It’s where the most variability can occur, and so where your demand planners should spend more of their time.
We discuss the three top methods for incorporating out-of-stocks in demand forecasting and the relative pros and cons of each.
Keep readingBuilding accurate demand forecasts requires more than just an understanding of the latest machine learning techniques; it also requires the right data and an understanding...
Keep readingThe global confectioner mitigates waste, improves service levels and controls costs by connecting digital supply chain visibility with POS analytics.
Keep reading