Amazon Retail Analytics Basic vs. Premium: What’s the value?

Date Posted: September 08, 2019

We’ve talked a lot about the importance of using data from your retailers, including point-of-sale, inventory, and forecasts, to grow market share and optimize inventory levels. The first step in that journey, is of course, getting that data from retailers. While most do share it, each does so in a slightly different way or even multiple ways, often at different levels of granularity and in their own “language.”

To help you sort through all these data formats and options from your various retailers, we’re using our blog to share what we’ve learned from working with our customers’ retail data every day. Today we start with looking at brands selling through Amazon Vendor Central, Amazon’s first-party vendor platform, where you’re selling items in bulk to Amazon and transferring product ownership to them (like you would any other retailer), so the product is noted as “Ships from and sold by Amazon.”

We’re starting with Amazon not only because so many brands sell through it, but if you’re looking to get a complete picture of your business, evaluating your online e-commerce channels is critical. By looking at e-commerce sales alongside brick-and-mortar, you can better understand what’s selling, where, and make replenishment and allocation decisions accordingly.

Brands using Amazon Vendor Central have access to Amazon Retail Analytics (ARA). ARA is an online portal that provides suppliers with sales, operations, and consumer behavior data. The sales and inventory data is typically used to analyze downstream supply chain dynamics such as sales patterns, stock movement, and returns. ARA is available in two versions: ARA Basic (available for free) and ARA Premium (available for a fee, which can be $30,000 or more per year).

Comparing ARA Basic and Premium

What are the differences between the ARA Basic and ARA Premium? How should you decide whether to stick with ARA Basic or invest in ARA Premium?

ARA Premium provides a number of metrics and reports that ARA Basic does not, such as traffic diagnostics and customer reviews. Here we’ll focus on differences in sales and inventory data, and what you will need to get closer to measuring true demand and taking control of your supply chain. Specifically, how you can optimize inventory management across your supply chain by balancing between minimizing lost sales from out-of-stocks (demand > supply) and minimizing holding costs of excess inventory (demand < supply).

Both ARA Basic and ARA Premium offer you gross sales units, returns units, price, cost of goods sold (COGS), on hand inventory units, on hand cost, and unsellable on hand units. Based on demand, they also provide sales and orders forecast, along with units in transit.

The main differences between ARA Basic and ARA Premium lie in three areas: time granularity, geographical granularity, and historical data availability.

  • While ARA Basic provides weekly data, ARA Premium provides daily data. An ARA Basic user will know how many of each product are sold in a particular week, but an ARA Premium user will know how many of each product are sold on any particular day.
  • While ARA Basic provides data by country, ARA Premium provides data by postal code. This data allows an ARA Premium user to have a more granular understanding of where their customers are located and conduct geographic analysis.
  • ARA Premium also allows for moderate data backup by providing historical data up to one year. So if an ARA Premium user did not download data from the portal for a few months, they can always return to the portal and download data dating a few months back.


Weighing the differences

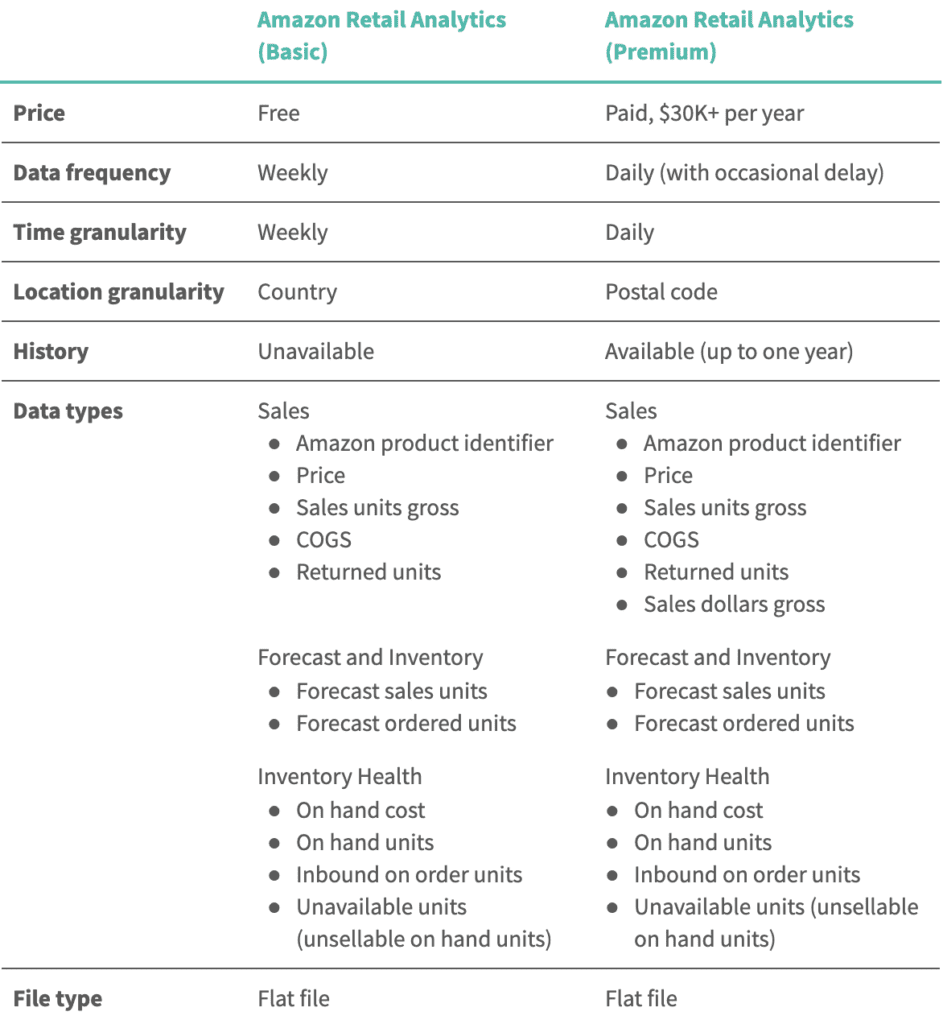
Historical data availability

History is essential for evaluating performance. One of the most common metrics consumer product companies look at is year-over-year (YoY) sales. It not only provides insights on overall sales trends, but also performance within a time period compared to the same time period in prior years.

Various demand forecasting algorithms also use historical sales data, where past sales performance is used in conjunction with factors such as product type and consumer demographics to forecast upcoming demand.

Although ARA Basic does not provide historical data beyond several days, you can make up for this lack of functionality by pulling the data weekly, or ideally daily, and creating your own set of historical data. However, this method is very vulnerable to data gaps. It requires someone to consistently pull the data and never miss a day. At Alloy.ai, we’ve developed automated tools to extract data upon availability, and seamlessly accumulate historical data. This approach guarantees data availability regardless of whether you have ARA Premium or ARA Basic, and saves the team from having to manually log in and download data every week.

Location granularity

Since Amazon is technically one big store, a postal code breakdown can help you isolate location-specific sales to see geographic trends and customer hotspots. You can also better track the impact of seasonal and regional media promotions by comparing sales in areas with promotions versus areas without.

There’s not as much you can do to make up for this lack of granular location data without more advanced techniques, like AI. We are developing ways to forecast and capture geographical demand that are customized to each client’s business.

Time granularity

Getting daily data updates can be critical if you hold promotions and participate in Amazon-special selling days like Amazon Prime Day(s). When you’re in the midst of these top selling days, you need to have a strategy to quickly get the data you need and efficiently respond to what’s happening in order to avoid missing out on major selling opportunities. Furthermore, obtaining data at the daily level is very valuable, especially for fast moving products with consistent demand. If you have ARA Basic and can’t access data at this granularity, you can fill in the gaps by intelligently extrapolating what’s happening at the weekly level. Then, you can make useful comparisons like what’s happening daily online vs. in-store.

Conversely, if you have ARA Premium, analyzing daily data may seem overwhelming because of the sheer number of data points, especially as your SKU count grows. You want to be able to automate as much as possible, and ideally manage by exception, such as with real-time alerts for situations that require your attention.

Gross Dollar Sales

Given sales units gross and average sale price, you can multiply the two to determine Gross Dollar Sales, even if Amazon Retail Analytics Basic does not provide it. Understanding dollars sold gives you a more accurate view of revenue, taking into account promotions and discounts, though it is one more calculation you have to do yourself.


Making a decision

Your product mix, inventory availability, promotional activity, seasonality, regional trends, and sales frequency can help you decide if the Basic or Premium version of Amazon Retail Analytics is right for you. If daily data, with history, and at the local level will help you manage your business better and increase sales, the investment in Premium may very well be worth it. As with any decision, weighing the cost against the likely impact on the bottom line is a good way to evaluate the options.

Regardless of which version of Amazon Retail Analytics you use, Alloy.a can help you take control of your supply chain. With Premium, we manage the large volumes of incoming data so you can quickly get sales, inventory and regional insights and trends. With Basic, Alloy.ai can help build out and save history, avoid any gap, and automatically calculate the missing sales dollars (along with hundreds of other metrics).

Related resources


Article

Talking better product launch and allocation decisions with Ferrero USA

The global confectioner mitigates waste, improves service levels and controls costs by connecting digital supply chain visibility with POS analytics.

Keep reading
Article

Say goodbye to constant supply chain firefighting: A guide

How to take an iterative approach to digital supply chain transformation with real-time alerts that motivate teams to collaborate on issue resolution

Keep reading
Article

New white paper exposes the gap between planning and execution

Understand how gaps between systems, teams and processes are keeping you constantly firefighting and hurting your supply chain resilience

Keep reading